

Prices Hit a Record. Sellers Are Cutting Anyway.
Two things are true in the DC and Maryland housing market right now, and they sound like they can't both be. Home prices in the Washington area just hit an all-time high. And in Anne Arundel County, half of all active listings have already cut their asking price. Facts over feelings, math over emotion: here's how both can happen at the same time, and what to do about it.
What Happened: Washington-Area Home Prices Reached a Record
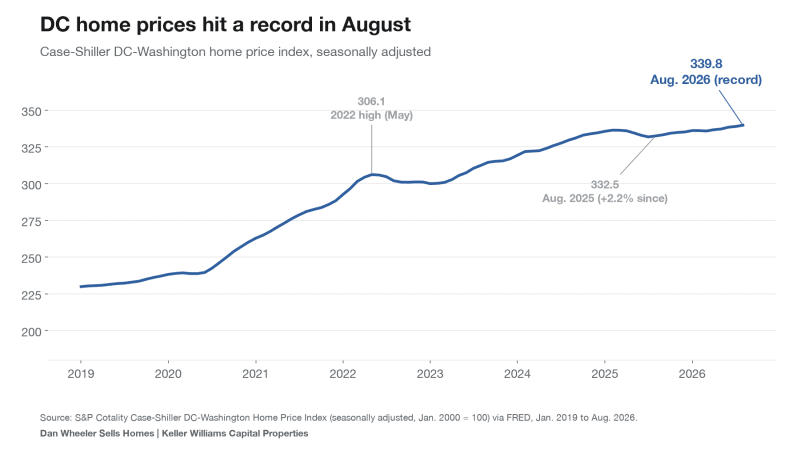
The S&P Cotality Case-Shiller index, released Oct. 27, showed Washington-area home prices up 2.2% in August from a year earlier, per the S&P release. The national index rose 2.1% and the 20-city index rose about 2.7%. On the seasonally adjusted DC-Washington series, August (339.8) is the highest reading since the index began in 1987, and a long way above the 2022 high of 306.1.
Case-Shiller tracks homes that actually closed, using repeat sales, so it moves slowly and lags the market by a couple of months. August is the latest month available. It tells you where prices have been, not where listings are priced today.
The Other Side: Asking Prices and Price Cuts in the DC and Maryland Housing Market
Now look at what sellers are asking today. Realtor.com data shows September median list prices were below last September in five of the six markets I track: DC down 10.4%, Montgomery down 8.0%, Prince George's down 4.8%, Anne Arundel down 4.0% and Harford down 3.1%. Charles was flat. Median list price is a mix of whatever happens to be on the market, so it isn't the same thing as home values, but it shows where sellers are starting.
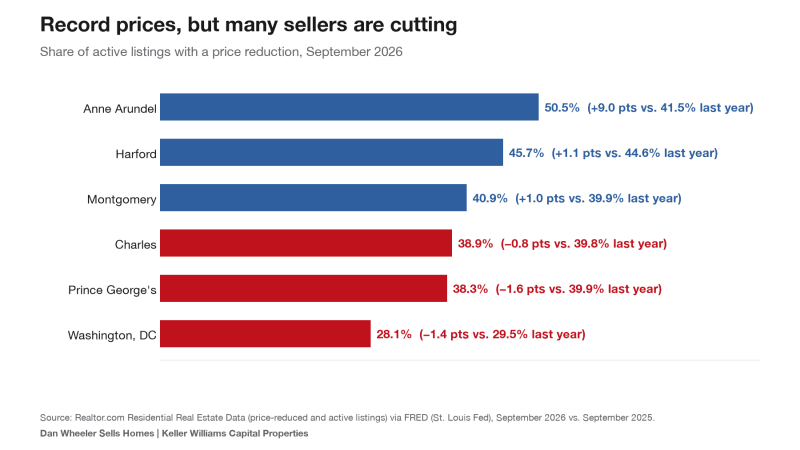
And plenty of them start too high. In September, 50.5% of active listings in Anne Arundel County had a price reduction, up from 41.5% a year ago. Harford was at 45.7% and Montgomery at 40.9%. Chart 2 has every county.
Why Both Are True
Closed prices reflect homes that were priced right and sold. Price cuts reflect the ones that weren't. When 7.24% mortgage rates (Freddie Mac, Oct. 29) meet a seller who is anchored to last spring's number, the house sits and the price drops. The record index and the high share of cuts are the same market sorting homes into "priced right" and "priced wrong."
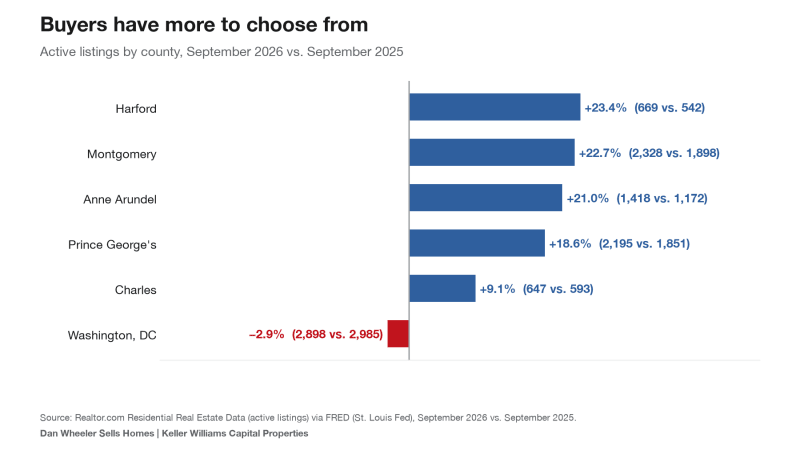
Supply is part of it. Active listings are up 9% to 23% year over year in every county I track except DC (chart 3).
Washington, DC Real Estate
DC is the tightest market in the set. Active listings were 2,898, down 2.9% from 2,985, and only 28.1% had a price cut (29.5% last year). Yet the median list price is down 10.4% to $527,500, so DC sellers who list realistically are still getting deals done.
Montgomery County Homes
Active listings jumped 22.7% to 2,328. About 40.9% have cut their price, up one point from last year. Median list price is $599,900, down 8.0%. More choice for buyers, and more reason for sellers to price sharply on day one.
Prince George's County Real Estate
Active listings are up 18.6% to 2,195. Price cuts touched 38.3% of listings, slightly fewer than last year's 39.9%. Median list price is $450,000, down 4.8%.
Anne Arundel County Housing Market
The warning sign in this set. Active listings are up 21.0% to 1,418, and 50.5% have a price reduction, a 9-point jump. Median list price is $524,945, down 4.0%. If you're selling here, overpricing is the most expensive mistake you can make.
Harford County Homes
Active listings are up 23.4% to 669, the biggest increase of the six. Price cuts are on 45.7% of listings. Median list price is $419,923, down 3.1%.
Charles County Real Estate
The calmest of the Maryland counties. Active listings are up 9.1% to 647, 38.9% have cut price, and the $475,000 median list price is unchanged from last September.
Listing figures are Realtor.com data via FRED for September 2026 vs. September 2025. Price-cut share is price-reduced listings divided by active listings.
What It Means for Buyers
A record index doesn't mean every house is a bad deal. It means the average home that closed was worth more than a year ago. The house you're touring may be one of the 4 in 10 that have already come down. Ask for the listing history, see how many days it has sat, and offer based on comparable closed sales, not the asking price. Start with my buyer checklist.
What It Means for Sellers
Don't price off the headline. A record Case-Shiller number tells you what sold. It doesn't promise your house will. With more competing listings and a 7.24% rate, the first two weeks decide whether you're a "priced right" sale or a "price cut" listing. Get a real comparison before you list: check what your home is worth and read 4 questions to ask before selling.
Dan's Take
This part is my interpretation, not data. Record prices make sellers feel rich, and that's how listings end up overpriced. Buyers can't pay a record price at a 7%-plus rate without a monthly payment that squeezes them, so something has to give, and right now it's showing up as price cuts rather than falling closed prices. I'd rather see sellers price correctly the first time than chase the market down.
Final Takeaway
Washington-area prices hit a record while 28% to 51% of listings in DC and these Maryland counties have cut their price. Action item: before you list or make an offer, pull the last 90 days of closed sales within a mile of the house, and ignore the asking prices. Happy to run that comparison for you.
FAQ: Home Prices in the DC and Maryland Housing Market
Are home prices in the DC area going up or down?
Depends on the measure. Case-Shiller (closed sales) was up 2.2% year over year in August 2026 and at a record. Median asking prices in September were lower than a year earlier in DC and four of the five Maryland counties I track.
What does a price reduction on a listing mean?
It means the seller lowered the asking price after listing, usually because the home didn't draw enough interest at the original price. A high share of reductions means many homes started out overpriced.
Is it a good time to buy in DC or Maryland?
That depends on your payment, timeline and local market. Buyers have more choices than a year ago in most Maryland counties, but the rate is still 7.24%. Run your numbers at today's rate before you decide.
Dan Wheeler | Keller Williams Capital Properties
Contact Dan · What's My Home Worth? · Schedule a Call · (301) 806-3179
Sources: S&P Cotality Case-Shiller Home Price Indices (Aug. 2026, released Oct. 27, 2026; DC-Washington series seasonally adjusted via FRED); Realtor.com active listings, price-reduced listings and median listing prices via FRED (Sept. 2026 vs. Sept. 2025); Freddie Mac PMMS (Oct. 29, 2026). Percentages are my own calculations. For education only, not financial advice. Data as of Oct. 31, 2026.