

Homes Are Sitting Longer, and Sellers Are Blinking
The DC and Maryland housing market has a patience problem. Listings are piling up in five of the six places I track, homes are taking longer to sell in all six, and in Anne Arundel County half of all active listings have already cut their price. The Fed announces its decision today, but this story was playing out long before the press conference. Facts over feelings, math over emotion. Here's the data.
What Happened: The DC and Maryland Housing Market Slowed Down in September
Realtor.com's September county data, published through FRED at the St. Louis Fed, shows the same pattern nearly everywhere: more inventory, slower sales, more price cuts. Mortgage rates are part of the reason. Freddie Mac's 30-year average was 7.32% on Oct. 22, versus 6.19% a year ago, per Freddie Mac. The next reading comes Thursday, Oct. 29.
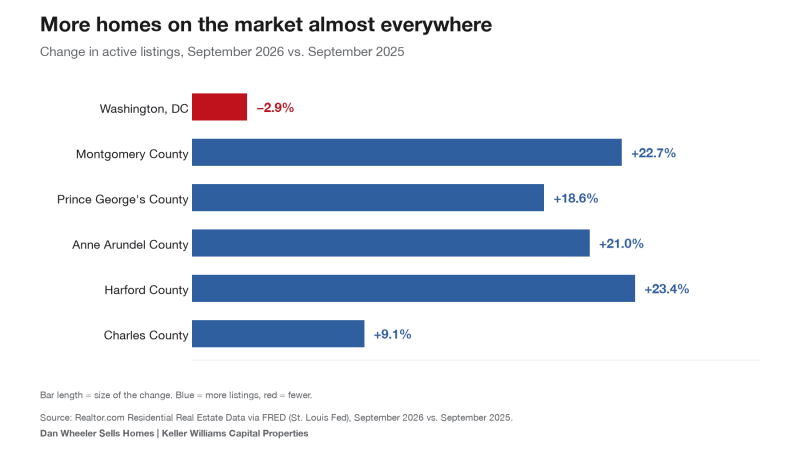
Start with supply. Active listings are up 9% to 23% in the five Maryland counties, and slightly down in DC.
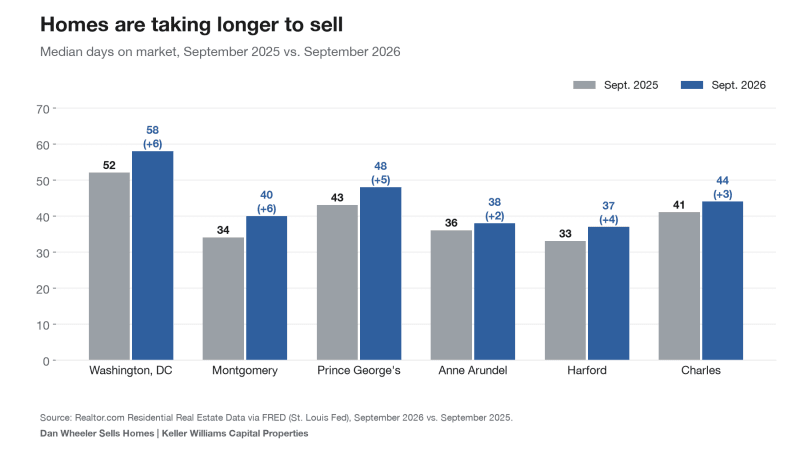
Homes Take Longer to Sell Across the DC and Maryland Housing Market
More inventory plus the same number of buyers means more waiting. The median time on market rose in every county I track. DC is the slowest at 58 days. Harford and Montgomery are among the fastest, but even they added days.
Washington, DC Real Estate
The one place where inventory fell: active listings dropped from 2,985 to 2,898 (-2.9%). Yet homes took longer to sell, 58 days versus 52 a year ago. About 28% of listings have a price cut, slightly below last year's 29.5%.
Montgomery County Homes
Active listings jumped from 1,898 to 2,328 (+22.7%). Median days on market went from 34 to 40. About 41% of listings carry a price cut, up from 40%.
Prince George's County Real Estate
Listings rose from 1,851 to 2,195 (+18.6%) and days on market from 43 to 48. The price-cut share slipped from 39.9% to 38.3%.
Anne Arundel County Housing Market
This is the standout. Listings rose from 1,172 to 1,418 (+21.0%), and the share with a price cut jumped from 41.5% to 50.5%, a 9-point leap. Days on market went from 36 to 38, the smallest increase of the six, so homes that are priced right are still moving. The ones that aren't are getting cut.
Harford County Homes
Harford had the biggest inventory jump, 542 to 669 listings (+23.4%). Days on market rose from 33 to 37, and the price-cut share is 45.7%, up from 44.6%.
Charles County Real Estate
The mildest change: listings up 9.1% (593 to 647), days on market from 41 to 44, and the price-cut share down slightly, from 39.8% to 38.9%.
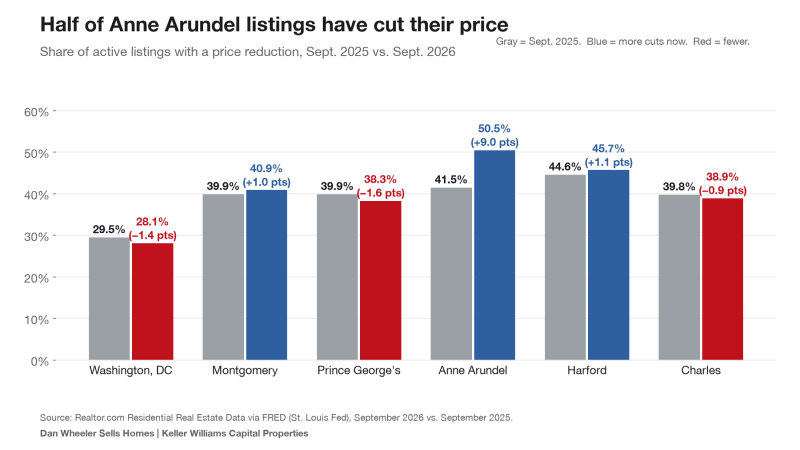
Price-cut share = active listings with a price reduction divided by all active listings, both from Realtor.com. Asking prices and listing activity, not closed sales.
What It Means for Buyers
You have more choices and more time than you did a year ago. That's real leverage, but it works on a house-by-house basis. Look for listings that have already sat for 30 days or more and have cut their price once. Those sellers are the most likely to talk about concessions, repairs or a rate buydown. Don't waste energy lowballing a fresh, well-priced listing. Start with my buyer checklist and get your payment numbers before you tour.
What It Means for Sellers
Buyers are comparing your home against more competition than last year. If half of the listings in your county have cut their price, the first price you picked may not be the price that sells. Price to the market from day one and you can avoid the stale-listing discount. Wondering where your home lands? Get a quick value check and read 4 questions to ask before selling.
Dan's Take
This part is my interpretation, not data. The numbers describe a market that is cooling, not collapsing. Days on market in the 30s and 40s are still not slow by historical standards. The big change is that sellers lost the ability to price on hope. In Anne Arundel, a price cut is now the typical experience, not the exception. I'd rather see a seller price correctly once than cut three times and chase the market down.
Final Takeaway
More homes, more days, more price cuts. The market is handing buyers time and handing sellers a bill for overpricing. Action item: before you list or make an offer, pull the sold and price-reduced homes within a mile of the address. They tell you what buyers are paying, not what sellers are asking. Happy to pull that list for you, free.
FAQ: DC and Maryland Housing Market Inventory and Price Cuts
Is the DC and Maryland housing market crashing?
No. The data shows more inventory, slower sales and more price cuts, which is a cooling market. Closed-sale prices and local conditions can differ, so ask for numbers on your neighborhood.
Should I cut my price if my home hasn't sold?
Look at your showings and feedback first. If buyers are touring and not offering, price is the most likely fix. If nobody is touring, the problem may be photos, marketing or timing.
Will the Fed's decision change any of this?
Not overnight. Mortgage rates follow longer-term bond yields rather than the Fed's overnight rate, so any move in your rate will depend on how the market reads the announcement.
Dan Wheeler | Keller Williams Capital Properties
Contact Dan · What's My Home Worth? · Schedule a Call · (301) 806-3179
Sources: Realtor.com Residential Real Estate Data via FRED (active listing count, median days on market, price-reduced listing count, county series, Sept. 2025 and Sept. 2026); Freddie Mac Primary Mortgage Market Survey. Percentages are my own calculations. For education only, not financial advice. Data as of Oct. 28, 2026.