

Homes for Sale Are Up 23%. Contracts Aren't.
Here's a number that should reset how you read the DC and Maryland housing market: for every 100 homes listed for sale in Montgomery County this September, only 34 were under contract. A year ago it was 53. More inventory is nice for buyers on paper, but it only helps if you know where the buyers actually went. Facts over feelings, math over emotion. Let's look at it county by county.
What Happened: Listings Up, Contracts Down in the DC and Maryland Housing Market
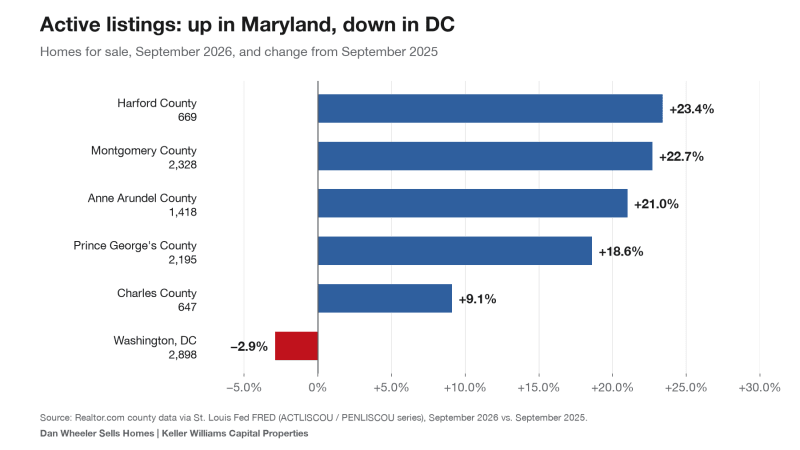
Realtor.com county data (via the St. Louis Fed's FRED database) shows September 2026 active listings up from last September in all five Maryland counties I track: Harford up 23.4%, Montgomery up 22.7%, Anne Arundel up 21.0%, Prince George's up 18.6% and Charles up 9.1%. DC was the exception, down 2.9%.
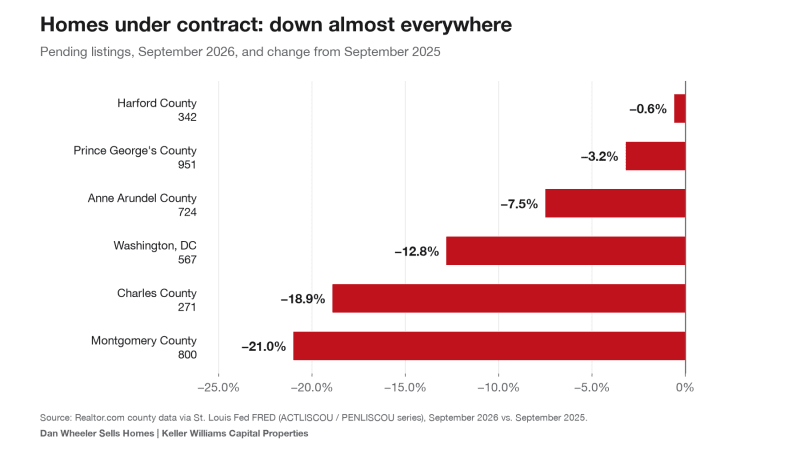
Now the other side. Homes under contract (pending listings) fell in all six markets: Montgomery down 21.0%, Charles down 18.9%, DC down 12.8%, Anne Arundel down 7.5%, Prince George's down 3.2% and Harford down 0.6%.
The Number That Matters: Contracts per 100 Listings
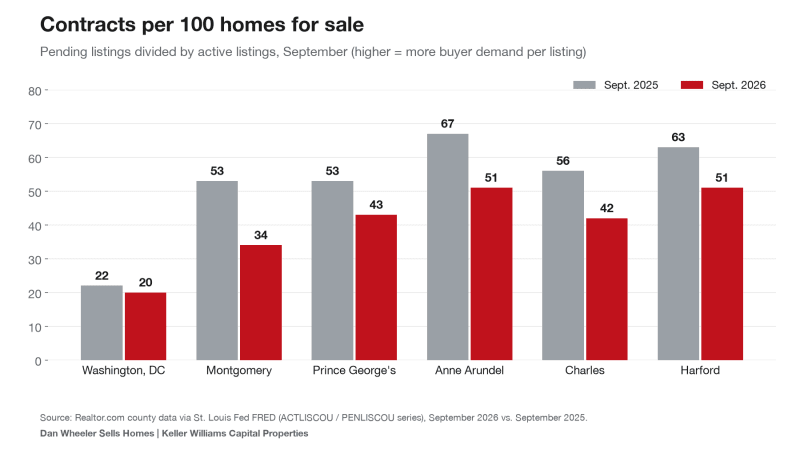
Divide pending listings by active listings and you get a rough read on how much buyer demand each listing is seeing. It's my own calculation, not an official statistic, but it's a handy yardstick:
- Washington, DC: 20 per 100 listings (22 a year ago)
- Montgomery: 34 (53)
- Prince George's: 43 (53)
- Anne Arundel: 51 (67)
- Charles: 42 (56)
- Harford: 51 (63)
Every market is lower than last year. Montgomery fell furthest, from 53 to 34. DC barely moved, but it started low and stayed low.
Washington, DC Real Estate
DC is the odd one out. Active listings are down 2.9% to 2,898, yet pending listings are down 12.8% to 567. Only about 20 homes are under contract for every 100 listed, the lowest of the six markets. DC isn't flooded with new supply. Buyers are just slower to pull the trigger, so homes that don't fit the market sit.
Montgomery County Homes
Montgomery is where the squeeze is clearest: 2,328 active listings (up 22.7%) against 800 pending (down 21.0%). That's the sharpest drop in contracts per listing anywhere in my set. If you're selling here, you have more competition and fewer buyers than last fall. Pricing and presentation matter more than they did a year ago.
Prince George's County Real Estate
Prince George's has the most listings of the Maryland counties, 2,195, up 18.6%. But pending sales held up better than most, down just 3.2% to 951. Demand per listing slipped from 53 to 43, so the market is softer, not broken.
Anne Arundel County Housing Market
Anne Arundel listings jumped 21.0% to 1,418 while pending sales slipped 7.5% to 724. It's still one of the busier markets (51 contracts per 100 listings), but that's down from 67 a year ago. Buyers have more choices and they know it.
Harford County Homes
Harford shows the biggest listing jump (up 23.4% to 669), yet contracts are almost flat, down 0.6% to 342. That's a market absorbing more supply better than most, though contracts per 100 listings still fell from 63 to 51.
Charles County Real Estate
Charles had the smallest rise in listings (up 9.1% to 647), but contracts fell 18.9% to 271. That's why the ratio dropped from 56 to 42. Fewer sellers listed, and buyers still pulled back.
A Quick Look at Northern Virginia
I'm keeping my focus on DC and Maryland today. If you're comparing across the river, check the latest Northern Virginia MLS report before drawing conclusions from these numbers.
Note: Realtor.com's counts use a different method than Bright MLS, so don't expect them to match Maryland REALTORS figures exactly. I'm comparing September to September within the same source.
What It Means for Buyers
You have more to choose from in Maryland, and sellers are seeing fewer contracts. That's leverage on price, repairs and closing costs, especially on homes that have been sitting. It's not leverage on the mortgage rate: the 30-year was 7.24% on Oct. 29 (Freddie Mac). Get pre-approved and know your payment first. My buyer checklist is a good starting point.
What It Means for Sellers
More competing listings and fewer contracts means the first price matters. Overpriced homes sit while the market passes them by. Check what your home is worth against recent closed sales, not last spring's neighbor, and read 4 questions to ask before selling.
Dan's Take
This part is my interpretation, not data. Rising inventory on its own doesn't make a buyer's market. Buyers have to be there too. What I see is a market where supply loosened and demand tightened at the same time, because 7%-plus rates are keeping people on the sidelines. The risk is on the seller side: a listing that's priced for last year's buyer.
Final Takeaway
Don't just count the homes for sale. Count how many are going under contract. Action item: look at how many homes near you went under contract in the last 30 days compared with how many are active, and price (or offer) based on that. Want me to pull it for your neighborhood? Just ask.
FAQ: Inventory in the DC and Maryland Housing Market
Is the DC and Maryland housing market now a buyer's market?
It's shifting that way in Maryland, where listings are up 9% to 23% year over year while contracts are down. DC is different, with fewer listings but weaker contract activity. Conditions vary by price point and neighborhood.
What does "pending listings" mean?
Pending listings are homes that have an accepted offer but haven't closed yet. It's a quick read on current buyer activity.
Should I wait to buy because inventory is rising?
That depends on your timeline, finances and rate. More choice helps, but rates are still above 7%. Run your numbers with a lender before deciding.
Dan Wheeler | Keller Williams Capital Properties
Contact Dan · What's My Home Worth? · Schedule a Call · (301) 806-3179
Sources: Realtor.com Residential Real Estate Data (active and pending listing counts, Sept. 2026 vs. Sept. 2025) via FRED, St. Louis Fed; Freddie Mac PMMS (Oct. 29, 2026). Percentages and contracts-per-100-listings are my own calculations. For education only, not financial advice. Data as of Nov. 4, 2026.