
DC Asking Prices Fell 10%. Per Square Foot, Just 1%.
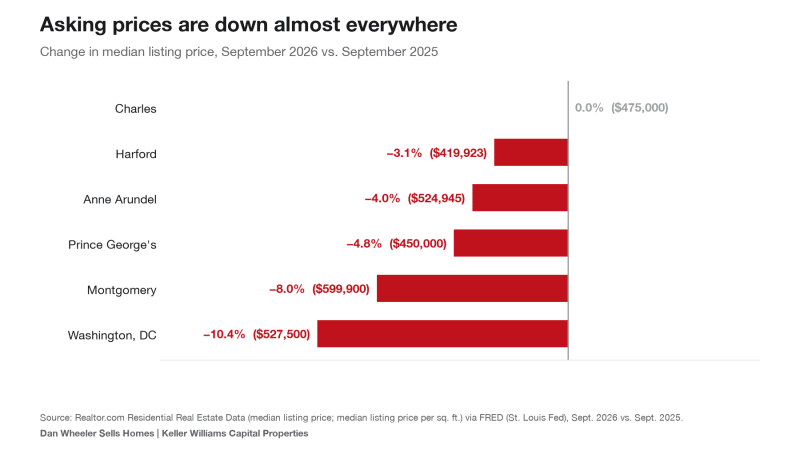
Headlines about the DC and Maryland housing market love a big number, and this one is a doozy: the median asking price in Washington, DC is down 10.4% from a year ago. Before you decide DC just got 10% cheaper, do the math. Price per square foot, the number that actually compares one house to another, moved only 1.2%. Facts over feelings, math over emotion: here's what's really going on, county by county.
What Happened: Median List Prices Dropped Across the DC and Maryland Housing Market
Realtor.com data (via the St. Louis Fed's FRED database) shows September 2026 median list prices below last September in five of the six markets I track: DC down 10.4% to $527,500, Montgomery down 8.0% to $599,900, Prince George's down 4.8% to $450,000, Anne Arundel down 4.0% to $524,945 and Harford down 3.1% to $419,923. Charles County was flat at $475,000.
If that's all you read, it looks like a broad price slide. It isn't quite that simple.
The Missing Piece: Price Per Square Foot in the DC and Maryland Housing Market
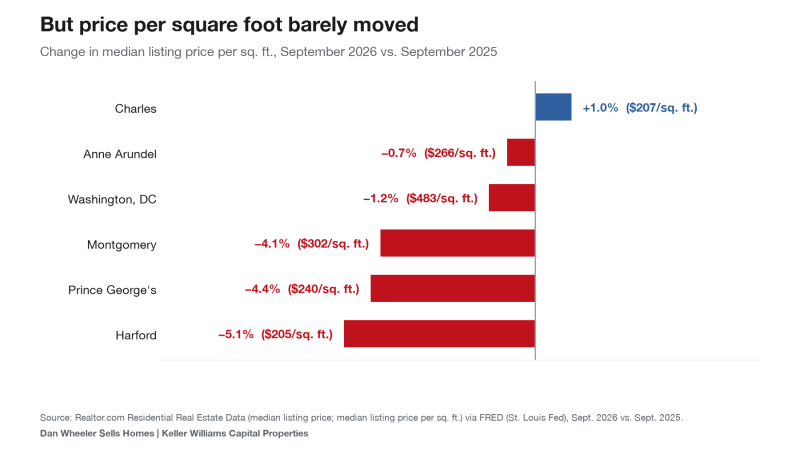
A median list price is just the middle of whatever happens to be for sale that month. If more small condos and fewer big houses hit the market, the median falls even if no seller cut a dime. Price per square foot strips out some of that noise. On that measure the story changes:
- DC: $483 per sq. ft., down 1.2% (from $489)
- Anne Arundel: $266, down 0.7%
- Montgomery: $302, down 4.1%
- Prince George's: $240, down 4.4%
- Harford: $205, down 5.1%
- Charles: $207, up 1.0%
Notice what flipped. DC went from the biggest drop to one of the smallest. Harford went from one of the smallest to the biggest. Same market, two different stories, depending on which number you read.
Why the Two Numbers Disagree
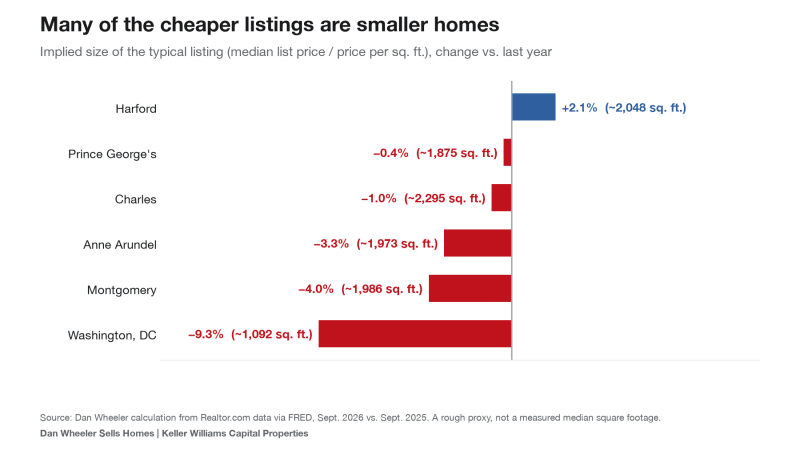
Divide the median list price by the median price per square foot and you get a rough proxy for the size of the typical listing. It's not a measured median square footage, so treat it as a clue, not a fact. But the clue is loud in DC: roughly 1,204 sq. ft. last September, roughly 1,092 this September, a drop of about 9%. That lines up with most of DC's 10.4% decline in list price. The typical DC listing got smaller, so the sticker price fell much more than the price per foot.
Harford goes the other way. The typical listing there looks about 2% larger, so a lower price per foot (down 5.1%) shows up as a smaller drop in sticker price (down 3.1%).
Washington, DC Real Estate
Median list price: $527,500 (down 10.4%). Price per square foot: $483 (down 1.2%). Active listings were 2,898, down 2.9% from last year. The headline decline looks mostly like a smaller mix of homes on the market, not DC sellers slashing prices. DC is still where you pay the most per foot, by a wide margin.
Montgomery County Homes
Median list price: $599,900 (down 8.0%). Price per square foot: $302 (down 4.1%). This one is real softness, not only mix. Roughly half of the drop in asking price shows up per foot too, and active listings are up 22.7%.
Prince George's County Real Estate
Median list price: $450,000 (down 4.8%). Price per square foot: $240 (down 4.4%). The two numbers agree here. The typical listing size is essentially unchanged, so this is a straight asking-price decline.
Anne Arundel County Housing Market
Median list price: $524,945 (down 4.0%). Price per square foot: $266 (down 0.7%). Mostly a smaller mix of listings, but half of active listings have a price cut (50.5%), so sellers here are already adjusting after listing.
Harford County Homes
Median list price: $419,923 (down 3.1%). Price per square foot: $205 (down 5.1%). The steepest per-foot drop in the group, partly hidden because the typical listing is a bit bigger than last year.
Charles County Real Estate
Median list price: $475,000 (flat). Price per square foot: $207 (up 1.0%). The only market in the set where the price per foot rose.
All figures are Realtor.com data via FRED, September 2026 vs. September 2025. These are listing (asking) prices, not sale prices. Percentages and the implied-size proxy are my own calculations.
What It Means for Buyers
Don't shop by headline number. When you compare houses, compare price per square foot in the same neighborhood, then adjust for condition, lot, and location. A buyer who sees "DC down 10%" and expects every rowhouse to be 10% cheaper will be disappointed. Use the per-foot number as a reality check, then offer from recent closed sales. My buyer checklist walks through it.
What It Means for Sellers
Your neighbor's price per foot is a better comp than a county-wide median. If your home is bigger than the typical new listing, the median asking price is not your number. Check what your home is worth using recent sales of similar-sized homes, and read 4 questions to ask before selling.
Dan's Take
This part is my interpretation, not data. I'd put more weight on price per square foot than on the median list price when I'm reading the market, and I'd put the most weight on closed sales. The per-foot data says DC is holding up better than the scary headline, and that Montgomery, Prince George's and Harford are the places where asking prices are genuinely drifting lower. With the 30-year mortgage at 7.24% (Freddie Mac, Oct. 29), that's what I'd expect: sellers adjusting while buyers hold out.
Final Takeaway
A big drop in median asking price can be a change in what's for sale, not a change in what homes are worth. Action item: next time you see a market headline, look up the price per square foot for your neighborhood and compare it with last year. Want me to run that for your street? Just ask.
FAQ: Asking Prices in the DC and Maryland Housing Market
Did DC home prices really fall 10%?
Median asking prices in September 2026 were 10.4% lower than a year earlier, but the median price per square foot fell only 1.2%. Much of the difference looks like smaller homes making up more of the listings.
What is median list price per square foot?
It's the middle asking price per square foot among active listings. It lets you compare homes of different sizes more fairly than the raw median price does.
Should I wait for prices to fall more before buying?
That depends on your payment, timeline and local market. Asking prices are softer in several Maryland counties, but rates are still above 7%. Run the numbers at today's rate and talk with a lender before you decide.
Dan Wheeler | Keller Williams Capital Properties
Contact Dan · What's My Home Worth? · Schedule a Call · (301) 806-3179
Sources: Realtor.com Residential Real Estate Data (median listing price and median listing price per square foot, Sept. 2026 vs. Sept. 2025) via FRED, St. Louis Fed; Freddie Mac PMMS (Oct. 29, 2026). Percentages and implied listing size are my own calculations. For education only, not financial advice. Data as of Nov. 2, 2026.