

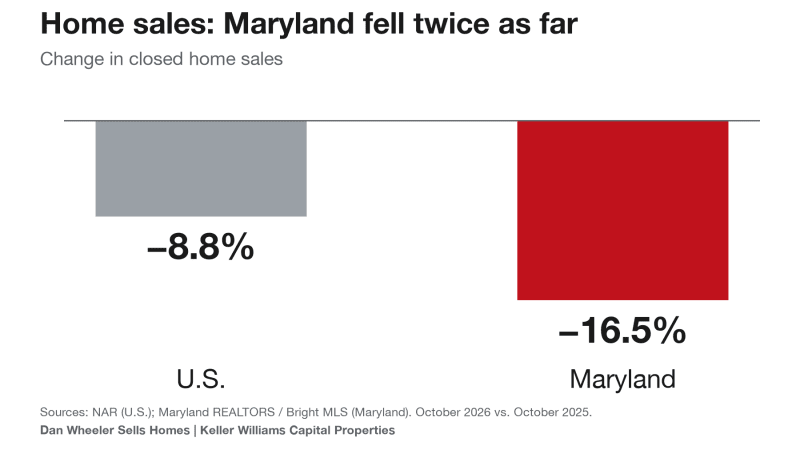
Maryland Sales Fell 16.5%. The U.S. Fell 8.8%.
Every few weeks a national headline tells you the housing market is frozen, and every few weeks someone asks me whether that applies to them. This week the headline is a good one: the National Association of REALTORS reported that existing-home sales hit their slowest pace since 2010. But if you live or buy in the DC and Maryland housing market, the national number understates what is happening here. Maryland's October closings fell almost twice as fast as the country's, and the reasons tell you a lot about how to buy or sell right now. Facts over feelings, math over emotion, so let's walk through it.
What Happened: A National Slowdown, Hit Harder Here
Start with the national picture. NAR reported that existing-home sales ran at a seasonally adjusted annual pace of 3.75 million in October, down 5.5% from September and 8.8% from a year earlier. That is the slowest pace since August 2010, back when the market was still digging out of the foreclosure crisis. The national median price was $416,700, up a modest 0.4%, and the 30-year mortgage rate averaged 7.33% in October, compared with 6.25% a year earlier (NAR). NAR's chief economist pointed to rates as the culprit, noting they were at their highest level since 2000 outside of one month in 2023.
Now compare that with Maryland. According to Maryland REALTORS, using Bright MLS data, 4,785 Maryland homes closed in October, down from 5,731 a year ago. That is a 16.5% drop, nearly double the national figure (Maryland REALTORS Housing Statistics). One caution before we go further: NAR's number is seasonally adjusted and covers the whole country, while the Maryland number is a raw count of closings, so the comparison is directional rather than exact. But a gap this wide is not a rounding error.
Why Maryland Is Slowing Faster
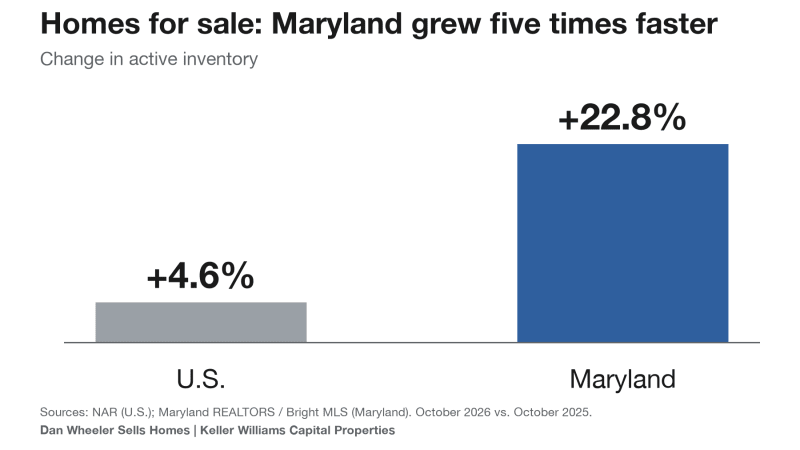
The honest answer is that nobody can prove a single cause from one month of data, but the supply numbers point to part of the story. Nationally, NAR counted 1.59 million homes for sale, up 4.6% from a year ago. In Maryland, active inventory rose 22.8% to 19,236 homes, roughly five times the national pace. Meanwhile, new listings in Maryland fell only 3.3%, while the number of homes under contract dropped 19.0%. Put those together and you get the picture: sellers kept listing homes at nearly the same rate as last year, but far fewer of those homes found a buyer, so the unsold ones piled up.
It helps to translate that into months of supply, which is how long the current inventory would last at the recent sales pace. Nationally it is 5.1 months, up from 4.4 a year ago, and five to six months is the usual rule of thumb for a balanced market. Maryland is at 3.6 months, up from 2.9. So we are still tighter than the country as a whole, which explains why prices have not collapsed here. But the direction matters more than the level: our supply is loosening faster than anywhere else I am tracking, and buyers can feel it even when the headline price barely moves.
Prices Are Holding, But Not Everywhere
Here is the part that surprises people. In a market where sales fall 16.5%, you might expect prices to drop by double digits. They did not. Maryland's median sales price was $430,000, down just 1.7% from $437,500. The national median actually rose 0.4%. The reason is simple: most owners do not have to sell. Plenty of Maryland homeowners locked in mortgages at far lower rates than today's, and moving would mean trading a low payment for a much higher one. So when offers come in low, they take the house off the market rather than cut the price. That keeps the median stable while the number of deals shrinks. This is my interpretation, not a number from a report, but it matches what the data shows: volume falls first, and price adjusts slowly and unevenly.
To see what buyers are up against, take that $430,000 median and assume a 20% down payment, leaving a $344,000 loan. At last year's 6.25% rate, principal and interest would be about $2,118 a month. At October's 7.33% average, it is about $2,365. That is roughly $247 more every month, or nearly $3,000 a year, for the same house at essentially the same price. Rates, not prices, are what is keeping buyers on the sidelines, and that is why a flat median does not mean an affordable market.
Washington, DC Real Estate
I could not verify DC-only closed-sales numbers today. Published reports conflict with each other, and I would rather leave a figure out than guess. What I can confirm is the broader Washington metro area from Bright MLS: 4,224 closed sales in October, down 19.2%, a median price of $625,000, down 0.8%, and new purchase contracts down 20.4%. That median decline was the first year-over-year drop in more than three years (FFXnow). Bright MLS's chief economist summed up the mood by saying buyers are holding back this fall with rates above 7%. For DC buyers and sellers, the metro numbers suggest the slowdown here is at least as sharp as Maryland's.
The Counties: Same Trend, Different Stories
Montgomery County Homes
Montgomery was the weakest of my counties for closings: 683 homes sold, down 19.0%. The median price was $617,778, down only 0.4%, which is a good example of sticky pricing. What changed is time and choice. Homes took a median of 19 days to sell instead of 13, active inventory rose 27.2%, and months of supply climbed from 2.4 to 3.1. Buyers in Montgomery have more options and more time than they did a year ago, even though the sticker prices look the same.
Prince George's County Real Estate
Prince George's closed 542 homes, down 17.9%, at a median of $449,000, down 1.0%. It has the most supply of my five counties at 4.1 months, up from 3.1, which puts it closer to the national 5.1 than the others. Interestingly, median days on market actually improved slightly, from 25 to 21, which suggests homes that are priced correctly still move. The problem is that fewer of them are being priced correctly.
Anne Arundel County Housing Market
Anne Arundel sold 515 homes, down 18.5%, yet the median price rose 4.6% to $507,340. Supply is the tightest of my counties at 2.6 months, up from 2.0, which is why sellers there still have leverage. Even so, days on market went from 13 to 18, a reminder that "tight" is relative.
Harford County Homes
Harford had the mildest drop in closings at 13.7% (226 homes), but it is where prices gave the most: the median fell 5.1% to $369,990. Inventory rose 28.5%, the most of the five, and median days on market jumped from 15 to 23. If you want a preview of what a price correction looks like in a market with a lot of new supply, Harford is the one to watch.
Charles County Real Estate
Charles closed 160 homes, down 14.9%, while the median price rose 4.4% to $453,000. Inventory grew the least of my counties at 14.7%, but homes there are sitting the longest, 34 days versus 26 a year ago. A slower market does not always mean a falling one, and Charles is showing the difference.
A Quick Look at Northern Virginia
Across the river, Fairfax County closed 810 homes in October, down 21.7%, with a median price of $739,450, down 0.7% (FFXnow). Same pattern: sharply fewer sales, nearly unchanged prices.
What It Means for Buyers
If you have been waiting for a sign that the market is tilting your way, this is it, with a caveat. You will not find a wave of 10% price cuts, because sellers are mostly refusing to cut. What you can find is negotiating room on everything around the price: repairs after inspection, seller-paid closing costs, a rate buydown, or a longer closing timeline. A one-point credit toward your rate can offset a meaningful chunk of that extra $247 a month. Freddie Mac reported the 30-year rate at 7.11% on November 12, and the next reading comes Thursday (Freddie Mac). If you are ready to start, my buyer checklist walks through the steps.
What It Means for Sellers
The most dangerous sentence in real estate right now is "it is slow everywhere." National headlines can make a seller feel justified in holding out for last year's price, but our local numbers are worse than the national ones, and buyers here have more choices than buyers in most of the country. Pricing against what homes actually sold for in your county over the last 90 days, not what the house down the street is asking, is the single best way to avoid sitting for 20-plus days. Check what your home is worth and read 4 questions to ask before selling before you list.
Dan's Take
This part is my interpretation, not data. I think the gap between Maryland and the nation comes down to how payment-sensitive our typical buyer is. Prices here are higher than the national median in most counties I track, so a point of interest rate costs a Maryland buyer more dollars a month than a buyer in a cheaper market. At the same time, many of our sellers are sitting on low-rate mortgages and can afford to wait. A payment-sensitive buyer meeting a patient seller produces exactly this: very few deals and very little price movement. NAR's chief economist said pent-up demand could build if rates fall, and I read that the same way for our counties. When rates do come down, I expect sales to bounce back faster than prices rise, because so many sidelined buyers are waiting for the same trigger.
Final Takeaway
National headlines are a starting point, not a pricing tool. The Maryland and DC-area market is slower than the country, has more homes on the market than a year ago, and is still holding most prices in place. That combination rewards people who do their homework. Action item: pull the last 90 days of closed sales within about a mile of the home you want to buy or sell, and compare them to the list price. That one comparison will tell you more than any national report.
FAQ: The DC and Maryland Housing Market
Is the Maryland housing market worse than the national market?
On sales volume, yes. October closings fell 16.5% in Maryland versus 8.8% nationally, and Maryland's median price slipped 1.7% while the U.S. median rose 0.4%.
What are mortgage rates right now?
Freddie Mac's 30-year average was 7.11% on Nov. 12. The next reading is due Thursday, Nov. 19.
Is it a good time to buy a house in Maryland?
Rates are high, but supply is up 22.8% and sellers are negotiating more. It depends on your budget and timeline, so run the numbers on your own payment before deciding.
Dan Wheeler | Keller Williams Capital Properties
Contact Dan · What's My Home Worth? · Schedule a Call · (301) 806-3179
Sources: NAR Existing-Home Sales, October 2026 (released Nov. 12, 2026); Maryland REALTORS Housing Statistics, October 2026 (Bright MLS data; preliminary); Bright MLS regional figures via FFXnow, Nov. 12, 2026; Freddie Mac PMMS. Monthly payments are my calculation (30-year fixed, 20% down on the $430,000 Maryland median, principal and interest only). Ratios and comparisons are mine. For education only, not financial advice. Data as of Nov. 18, 2026.