

Inventory is surging, but not all listings are created equal
Have you noticed more homes popping up for sale lately? After years of painfully low inventory, the number of active listings is finally starting to rise. On the surface, that sounds like great news for buyers who’ve been frustrated by limited choices. But here’s the catch: while the market as a whole is seeing more supply, not every type of home is easy to find.
So what does this really mean? Are buyers about to have the upper hand, or are sellers still sitting in the driver’s seat? The answer isn’t as straightforward as it seems—and it could directly impact your next move.
Inventory is climbing, which has been welcome news for prospective homebuyers. However, the inventory picture is very different depending on where you are and the type of home you’re looking for.
According to data from realtor.com, at the end of May 2025, total inventory across the U.S. was at about 90% of the May 2019 level. But a very distinct pattern emerges when you look at inventory by metro area. Inventory levels surpass 2019 levels in southern metros in Florida, Texas, and Arizona as well as in Washington and Oregon in the Pacific Northwest. By contrast, inventory across the Midwest and Northeast, as well as in Southern California, remains below 2019 levels.
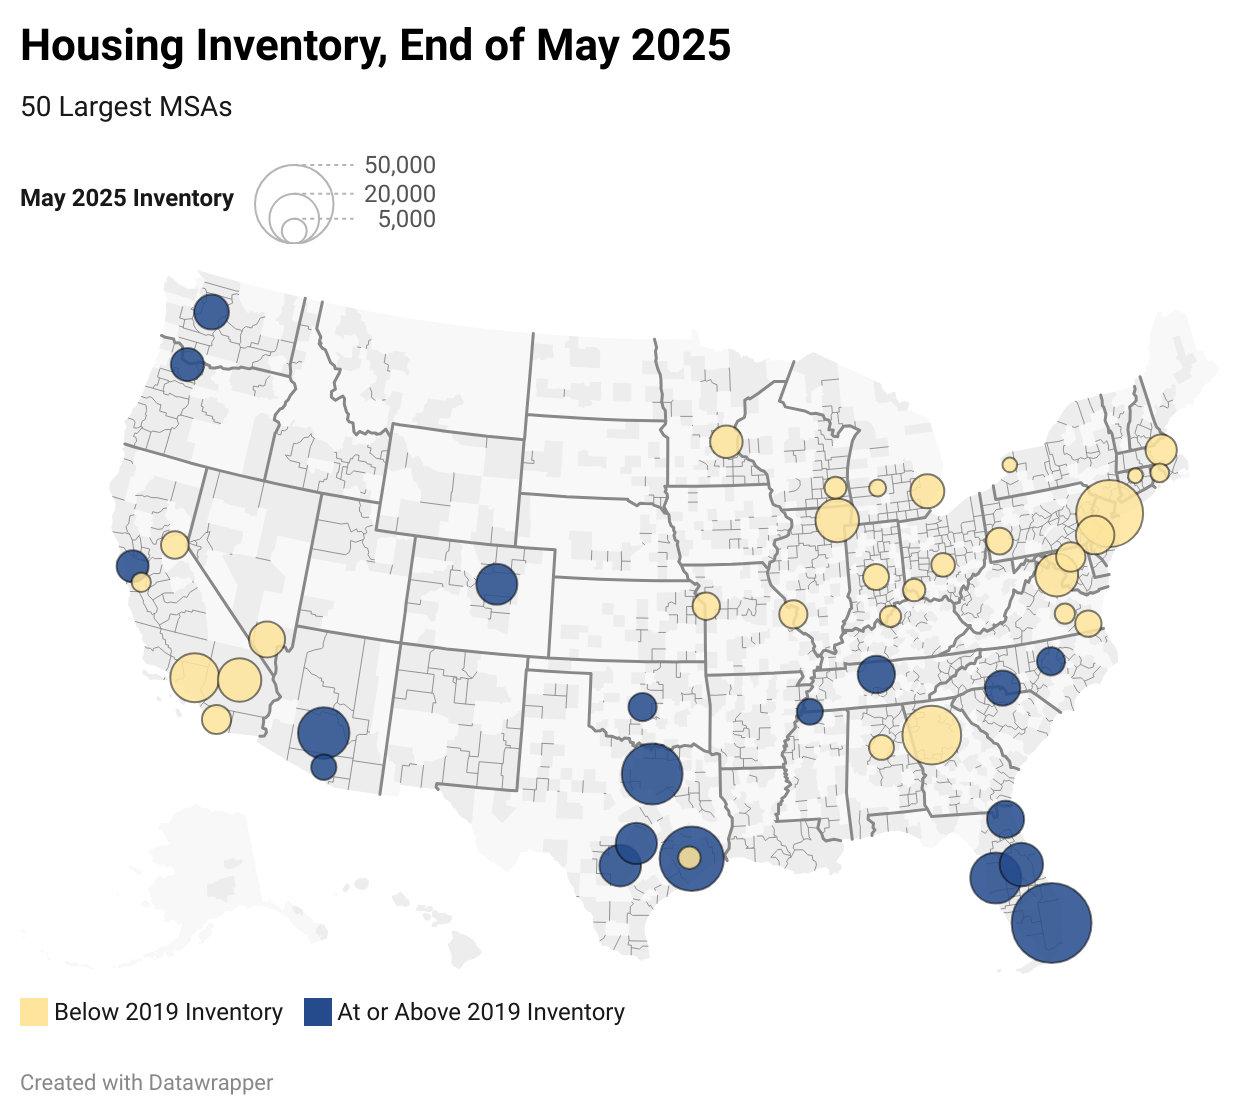
Data source: realtor.com
DMV inventory remains tight
In the DMV area there were 42,981 active listings on the market at the end of May 2025. The number of active listings is now 25.1% higher than it was a year ago and inventory has been increasing across the Mid-Atlantic region for 16 consecutive months, as more homes are listed for sale and properties remain on the market longer.
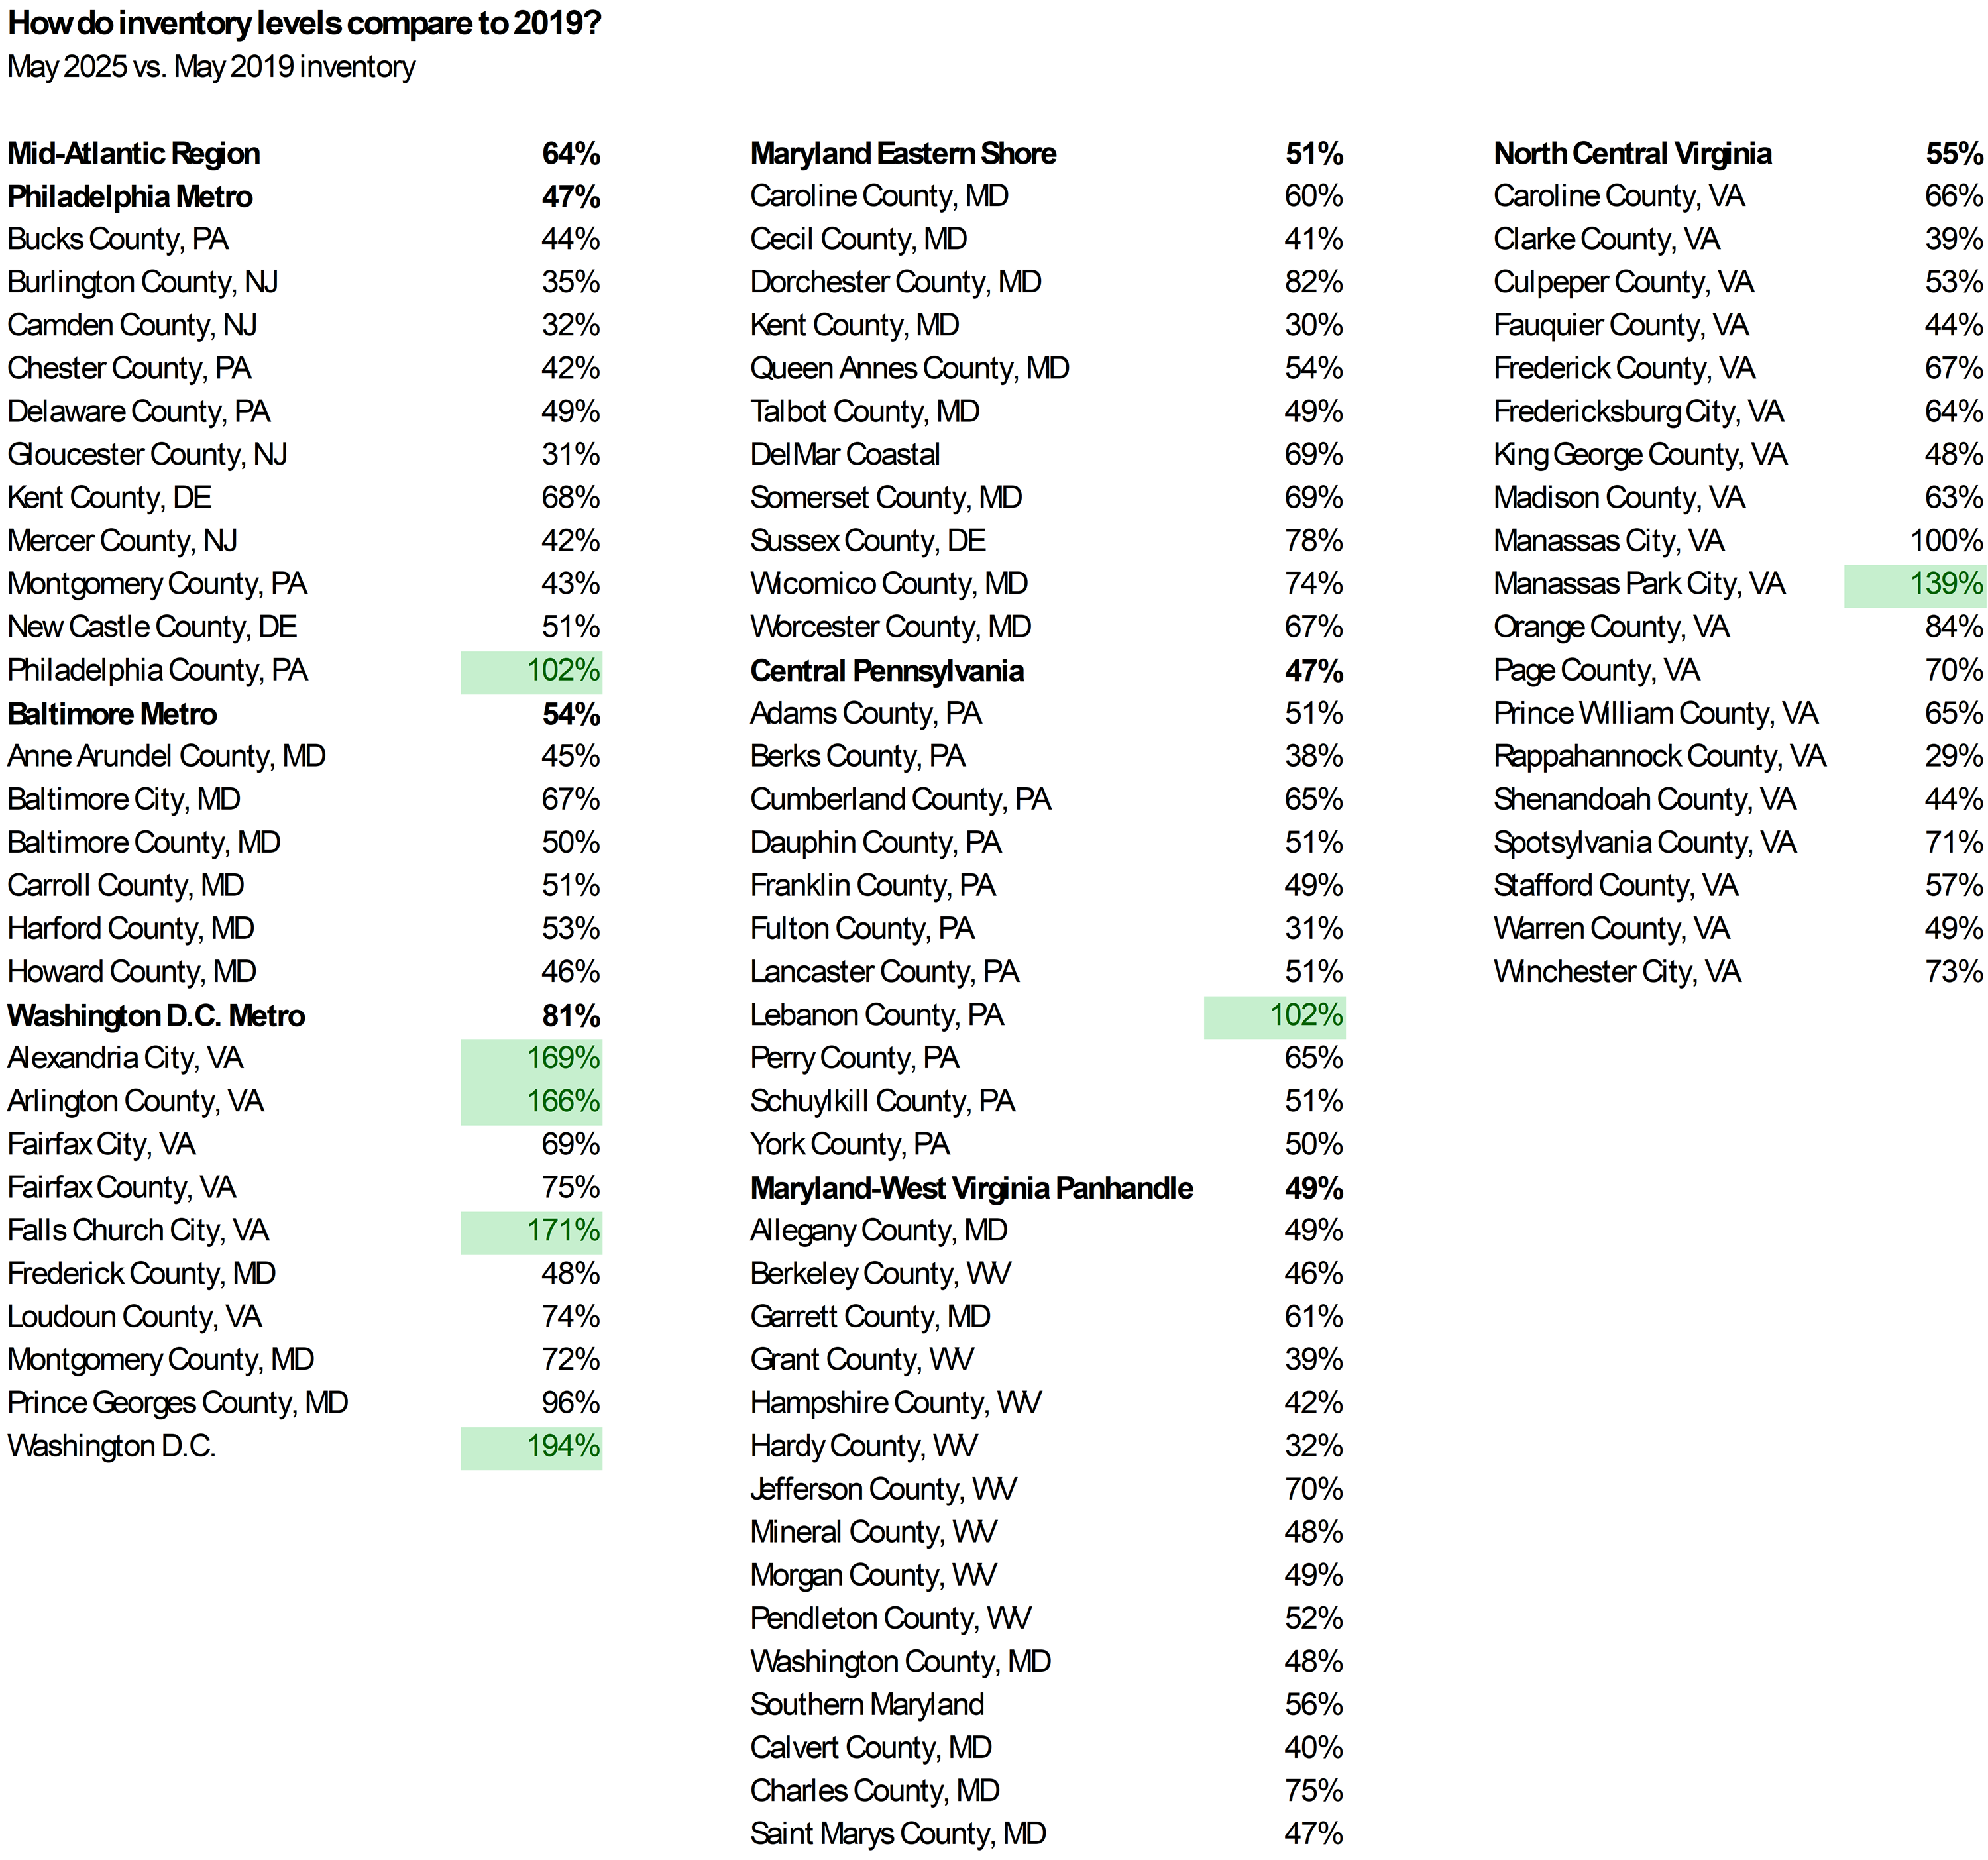
However, despite the rapid rise, inventory is still well below pre-pandemic levels in most local markets across the DMV. Overall, May 2025 inventory is just 64% of the May 2019 level across DMV's footprint. In fact, there are just a handful of counties in the region where inventory has surpassed 2019 levels.
The urban area housing markets tend to have more inventory. In both Philadelphia and Washington, D.C., inventory is above pre-pandemic levels. In the close-in suburbs of Arlington and Alexandria, Virginia, inventory has also surpassed what was available to buyers in 2019.
There are many more local markets where inventory is still less than half of what was available in 2019. In most of the Philadelphia suburbs, for example, the number of active listings in May 2025 is less than 50% of May 2019 levels.
Source: BrightMLS
So, while more inventory is a welcome change for homebuyers in the marketplace, inventory is still relatively tight across much of the DMV region and sellers do still have the upper hand in the market.
Lower-priced homes, homes with price adjustments sell more quickly
In the DMV area, homes available for sale at the end of May 2025 have been on the market an average of 75 days. By contrast, homes that went under contract in May had been on the market an average of 29 days. Pricing makes a difference on whether a property sells and how long it takes to go under contract.
At the end of May 2025, the median original list price of a home for sale in the DMV was $472,814. In general, prices of homes currently available for sale are nearly 10% higher than the prices of homes that went under contract during the month. Part of the reason for this price differential is that sellers are cutting prices to attract offers. More than a quarter (25.2%) of homes that went under contrast last month had had a price drop and among those that did, the average cut in asking price was 6.6%.
Sellers are adjusting price expectations as the housing market is shifting. In the DMV, one out of 10 homes on the market had a price cut during the week ending June 8, and the share of listings with a price cut has been rising steadily throughout the year.
These pricing trends suggest that homes at lower price points and homes where the seller is willing to drop the price are more likely to sell, while higher-priced homes are more likely to linger on the market.
The Washington, D.C., area market looks different
The notable exception to this pattern is in the Washington, D.C., and Northen Virginia regions. The median price of listings active for sale at the end of May is actually less than the median price of homes that went under contract during the month. In these markets, buyers in the higher end of the market appear to be more active than buyers in the mid- and lower-priced markets.
The median price of active inventory was higher than the median price of homes going under contract in all states except Virginia and Washington, D.C., where sales were higher-priced.
Home Prices: Listings vs. Sales
| MEDIAN ORIGINAL LIST PRICE ($) | ||
|---|---|---|
| State | Homes Under Contract (May 2025) |
Active Listings (End of May 2025) |
| Washington, D.C. | $650,000 | $600,000 |
| Delaware | $399,999 | $479,990 |
| Maryland | $445,000 | $469,650 |
| New Jersey | $399,900 | $420,000 |
| Pennsylvania | $360,000 | $382,995 |
| Virginia | $610,000 | $579,950 |
| West Virginia | $335,000 | $379,900 |
| Bright MLS Service Area | $435,000 | $472,814 |
Home shoppers want single-family homes, but condo inventories are rising faster
At the end of May, more than half of all listings on the market in the DMV area (57%) were single-family detached homes, 27% were townhomes, and 16% were condos. The mix of property types on the market is slightly different from what buyers appear to be looking for.
Among homes sold in May, a higher share (60% vs. 57%) were single-family detached homes, while 29% were townhomes and only 11% were condo sales.
Therefore, while inventory is climbing in many markets, it is not always the case that the types of homes in a particular market line up with what homebuyers are looking for. Condominiums, in particular, are over-represented in the inventory as more buyers are looking for single-family properties. If buyers are willing to widen their home search to condos, they will likely find more options and more sellers willing to negotiate.
Property Type: Listings vs. Sales
| Property Type | Homes Under Contract (May 2025) |
Active Listings (End of May 2025) |
|---|---|---|
| Single-family Detached | 60% | 57% |
| Townhome | 29% | 27% |
| Condo | 11% | 16% |
Outlook for Inventory
The fact that there are more active listings is good news for prospective homebuyers who have been frustrated by historically low inventory. But buyers need to be sure to work with a local real estate professional to get data on inventory trends in the local markets they care about. In addition, while inventory is increasing overall in most places, there are still some types of properties that are hard to find.
